Quick Bites:
-
- A state’s total “tax burden” includes income tax, property taxes, and sales and excise taxes.
- There is a correlation between state tax burdens and migration patterns — but it’s not a perfect one. Other factors such as real estate affordability and climate impact where Americans are moving, too.
- High-tax states have made it harder for residents to leave in recent years, including tax audits and tracking EZ-Pass movements.

Do states with population growth charge lower taxes than states losing population?
United Van Lines releases a report every year on the prior year’s migration patterns within the United States. In early 2024, they issued their 2023 report, coinciding with U.S. Census Bureau population data released at the end of 2023.
But where it really gets interesting is how taxes affect where Americans are moving. A 2024 survey by USA Today found that nearly two-thirds (62%) of movers listed public policy as a driver of their move, and 26% specifically cited taxes.
The correlation between state tax burden and state net migration is striking. Remember, income taxes aren’t the whole picture when it comes to residents’ tax burden. Property taxes and sales and excise taxes round out the total tax burden in each state.
Going even further, how do migration patterns and tax burdens align with real estate appreciation? What does the data indicate about opportunities for real estate investors?
Glad you asked.
State Tax Burden: The Trifecta
Property taxes matter, especially to real estate investors, but for residents they make up only one of three variable taxes: property tax, income tax, and sales and excise taxes. For those of you who need brushing up on your tax terminology, excise taxes are levied on specific types of goods, such as alcohol, tobacco, gasoline, and so on.
Every year, WalletHub compiles data on all three tax types into a chart summarizing total state tax burden, for all 50 states. They break down each of the three tax types as a percentage of income in that state. Thus, property taxes don’t represent the rate at which assessments are taxed, but that average percentage of residents’ income that goes to property taxes. That distinction also takes into account variations in property values between the states.
Likewise with sales tax — it’s not the tax rate, but how much each resident loses to sales and excise taxes each year.
Without further ado, here’s the 2024 map summarizing all state taxes by state:
If you’re wondering about which state taxes are highest, beware of these top ten highest-tax states:
| Rank | State | Total Tax Burden | Property Tax Burden | Income Tax Burden | Sales & Excise Tax Burden |
|---|---|---|---|---|---|
| 1 | New York | 12.02% | 4.36% | 4.63% | 3.03% |
| 2 | Hawaii | 11.80% | 2.64% | 3.82% | 5.34% |
| 3 | Vermont | 11.12% | 4.85% | 3.09% | 3.18% |
| 4 | Maine | 10.74% | 4.86% | 2.59% | 3.29% |
| 5 | California | 10.40% | 2.73% | 4.87% | 2.80% |
| 6 | Connecticut | 10.08% | 3.95% | 3.42% | 2.71% |
| 7 | Minnesota | 9.95% | 2.82% | 4.01% | 3.12% |
| 8 | Illinois | 9.67% | 3.67% | 2.57% | 3.43% |
| 9 | New Jersey | 9.47% | 4.59% | 2.36% | 2.52% |
| 10 | Rhode Island | 9.38% | 3.83% | 2.49% | 3.06% |
At the other end of the spectrum, here’s the state tax comparison for the lowest-taxed states:
| Rank | State | Total Tax Burden | Property Tax Burden | Income Tax Burden | Sales & Excise Tax Burden |
|---|---|---|---|---|---|
| 41 | Nevada | 7.37% | 2.02% | 0.00% | 5.35% |
| 42 | Oklahoma | 7.04% | 1.71% | 1.75% | 3.58% |
| 43 | North Dakota | 6.80% | 2.44% | 0.90% | 3.46% |
| 44 | South Dakota | 6.44% | 2.58% | 0.00% | 3.86% |
| 45 | Delaware | 6.43% | 1.85% | 3.57% | 1.01% |
| 46 | Tennessee | 6.07% | 1.64% | 0.05% | 4.38% |
| 47 | Florida | 6.05% | 2.61% | 0.00% | 3.44% |
| 48 | Wyoming | 5.70% | 3.10% | 0.00% | 2.60% |
| 49 | New Hampshire | 5.63% | 4.51% | 0.15% | 0.97% |
| 50 | Alaska | 4.93% | 3.54% | 0.00% | 1.39% |
That’s a huge difference in state tax burden; New York residents pay roughly two-and-a-half times the state taxes as their counterparts in Alaska do, as a percentage of their income.
It’s worth mentioning that seven states charge no income tax at all: Alaska, Florida, Nevada, South Dakota, Texas, Washington, and Wyoming. Another two states (New Hampshire and Tennessee) do not charge any income taxes on earned income (wage/salary income), but do charge income taxes on investment income such as rental income, dividends, and interest.
States with Population Growth
According to Census Bureau data from mid-2022 through mid-2023 (released at the end of 2023), here’s how the map breaks down for states with population growth and loss:
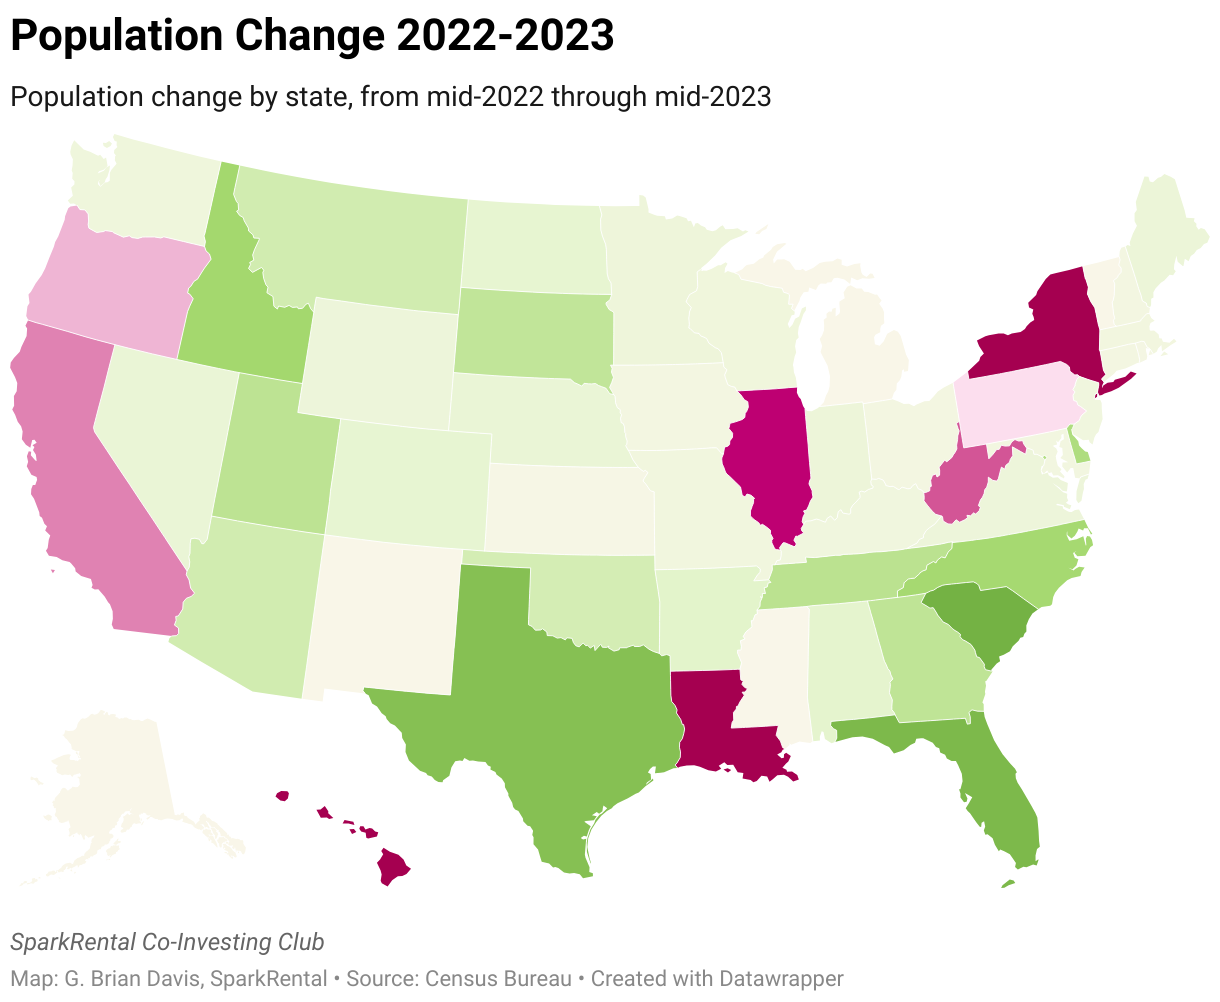
It’s not a perfect correlation with tax rates, but you can definitely see a pattern. Consider the states with the highest population growth:
| State | April 2020 Population | July 2023 Population | Population Change | Percent Change |
|---|---|---|---|---|
| Idaho | 1,839,117 | 1,964,726 | 125,609 | 6.8% |
| South Carolina | 5,118,422 | 5,373,555 | 255,133 | 5.0% |
| Florida | 21,538,216 | 22,610,726 | 1,072,510 | 5.0% |
| Texas | 29,145,459 | 30,503,301 | 1,357,842 | 4.7% |
| Montana | 1,084,244 | 1,132,812 | 48,568 | 4.5% |
| Utah | 3,271,614 | 3,417,734 | 146,120 | 4.5% |
| Delaware | 989,946 | 1,031,890 | 41,944 | 4.2% |
| Arizona | 7,157,902 | 7,431,344 | 273,442 | 3.8% |
| North Carolina | 10,439,459 | 10,835,491 | 396,032 | 3.8% |
| South Dakota | 886,668 | 919,318 | 32,650 | 3.7% |
Now look at the states with the fastest population loss:
| State | April 2020 Population | July 2023 Population | Population Change | Percent Change |
|---|---|---|---|---|
| New York | 20,202,320 | 19,571,216 | -631,104 | -3.1% |
| Illinois | 12,813,469 | 12,549,689 | -263,780 | -2.1% |
| Louisiana | 4,657,785 | 4,573,749 | -84,036 | -1.8% |
| District of Columbia | 689,548 | 678,972 | -10,576 | -1.5% |
| California | 39,538,212 | 38,965,193 | -573,019 | -1.4% |
| Hawaii | 1,455,274 | 1,435,138 | -20,136 | -1.4% |
| West Virginia | 1,793,713 | 1,770,071 | -23,642 | -1.3% |
| Mississippi | 2,961,306 | 2,939,690 | -21,616 | -0.7% |
| Massachusetts | 7,032,933 | 7,001,399 | -31,534 | -0.4% |
| Michigan | 10,077,674 | 10,037,261 | -40,413 | -0.4% |
How do state population changes compare to state tax burden?
The average population loss in the ten highest taxed states was -0.25% over the last two years. The average population growth in the ten lowest taxed states was 1.83%. That’s a huge difference in state population growth, given the number range.
The average tax burden in the fastest-growing states was 7.66%. Meanwhile, the states with the worst population decline averaged a tax burden of nearly 10% (9.90%).
But the data doesn’t end with the annual growth rate. Let’s bring in another data source for state net migration patterns, to align state migration with state tax burden and states with population growth.
State Net Migration Patterns
Continuing a long-term trend, internal migration shows Americans moving away from the Northeast and Upper Midwest, which tend to charge high state tax rates. Remember, the United Van Lines data reflects domestic migration, not international migration. In contrast, the Census Bureau population estimate data above includes all forms of population change, including immigration.
Take a look at the state migration rates map:
Look familiar?
Again, it doesn’t perfectly match the map of states with population growth, or the tax burden map. Look at Vermont — high taxes, cold winters, but people are flocking there in droves (however many people a “drove” is). Vermont does have several points in its favor though; the people are friendly and educated, and the skiing, hiking, and beer are outstanding.
The ten states with the most outbound migration imposed an average tax burden of 8.76%. Meanwhile, the states with the most inbound migration had an average tax burden of 7.91%. Not an enormous difference, but still measurable and statistically significant.
(article continues below)
Real estate investments? Awesome.
Being a landlord? Less fun.
Learn how to earn 15%+ on passive real estate investments in our free video course.

Red vs. Blue States
You simply can’t separate a conversation about taxes from politics. State tax comparison data just begs for political commentary.
First, the raw numbers. Based on which way each state swung during the 2020 presidential election, Republican states have an average state tax ranking of 31.32 out of 50 (higher rank = lower taxes). Democratic states ranked 19.68 on average, showing that in general, states do tax according to their political principles.
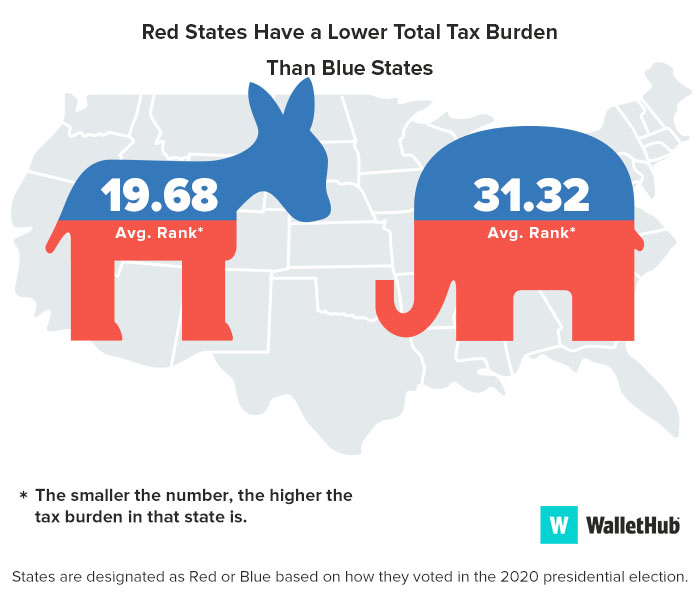
Of the ten states with the highest state tax burden, nine swung blue in the last election (exception: Iowa). Among the ten states with the lowest tax burden, eight of the ten voted Republican (exceptions: Delaware and New Hampshire).
While there’s a clear trend, it’s not a perfect 1:1 correlation. The outliers demonstrate that some Democratic states maintain frugally low tax rates.
It’s worth mentioning a fundamental difference in taxation philosophy between liberals and conservatives, when it comes to the ever-slippery concept of “fairness.” As a general rule, liberals believe that better-off individuals should pay disproportionately higher tax rates. The easiest way to do that is through a highly progressive income tax bracketing system. That means that not only do higher earners pay higher dollar amounts in taxes, they also pay a higher percentage of their income.
Meanwhile, conservatives tend to favor use taxes. That means that ideally, people pay more in taxes for services they use more. For example, people who drive more should pay more money toward road infrastructure and environmental remediation, in the form of gasoline taxes, tolls, or vehicle registration fees. Therefore, an environmentally-minded person who doesn’t own a car (like, cough, myself) would pay less for road maintenance, while the person who spends two hours behind the wheel every day would pay more.
Which philosophy is right? Are use-based or wealth-based taxes more “fair?” It’s a matter of opinion. As someone who leans fiscally conservative and socially liberal, I personally favor use taxes. In particular, I like sales and excise taxes over income taxes, because ideally we want to reward good financial behavior like hustling to earn more money, and penalize behavior like high spending and consumerism. But I digress.
The Impact of Property Taxes
Americans paid over $577.01 billion (that’s $577,010,000,000!) in property taxes in 2019 (the most recent year available).
Property taxes are particularly relevant to real estate investors, given their direct impact on cash flow. What’s tricky about property taxes is that they vary by county, not by state. So while we can look at state averages, like WalletHub did, the data has its limits.
But even when we drill down to the local level, the property tax map tells a familiar tale:
They’re particularly gnarly in the Northeast, with New England states charging high property tax rates.
And, of course, assessors love to overestimate your property’s value. More on how property taxes are calculated here.
It’s worth noting that Texas, with its high property taxes, actually has a relatively low total tax burden, because it imposes no income tax. That’s one reason why it’s not suffering from outbound migration like most of the other regions with high property taxes.
United Van Lines noted in their report that while many Americans are moving into cities, that trend is still heavily overshadowed by the ongoing migratory trend away from the Northeast and Midwest.
Changing State Residency Without Moving Full-Time
I’ve heard a few real estate investors ask over the years:
“Can I change my official state residency without actually living full-time in that state?”
It’s an interesting question, in an era when people can telecommute. I myself am location-independent. Before moving abroad, I changed my official state residency from high-tax Maryland to low-tax Florida.
There are private mail services out that that provide a physical mailing address for you, and can digitally upload or forward your mail to you per you request. People who spend a lot of time RVing or living on a boat use services like these, as do expats (like me), travel nurses, and the like. You may be able to use the mail service address as your primary address for establishing residency.
Your Old State May Not Let You Go
If you have a full-time job that requires you to be in a fixed place year-round, your home state will not let you pretend you’re not there. They have all kinds of creepy tricks to know where you are, from tracking your vehicle movements on EZ-Pass to mobile phone GPS data to credit card transactions.
High-tax states in particular have started automatically checking these sorts of location signals when people move their residency out of state. Massachusetts used automated data (such as EZ-Pass records) to track former residents’ movements and automatically trigger audits. Meanwhile, a study in 2023 found record numbers of Massachusetts residents leaving.
If you earn a decent living and live in a high-tax state, the state tax authority might audit you when you try to move your residency out of state. That chance rises exponentially if you leave a trail of electronic records showing that you still spend a lot of time in your old state.
Minnesota even tried to pass a “snowbird law” that anyone in the state for more than 60 days/year (rather than more than 183 days/year) would be subject to Minnesota state taxes. The initiative failed, but the Minnesota government continues to aggressively audit part-time residents (see the Minnesota Supreme Court ruling).
As an interesting aside, Minnesota lost $6.45 billion in taxable incomes to residents fleeing the state and moving elsewhere, between 1992-2014. Guess where most of those fleeing residents moved? Nearly half moved to tax-free Florida, another quarter moved to low-tax Arizona, and the bulk of the rest went to tax-free Texas.
You need to make an ironclad case that you’ve actually left. Start by getting a new driver’s license (no test required in most cases), changing your mailing address with the US Postal Service, registering to vote. Register your vehicle. Get a library card. Pass Go, collect $200.
(article continues below)
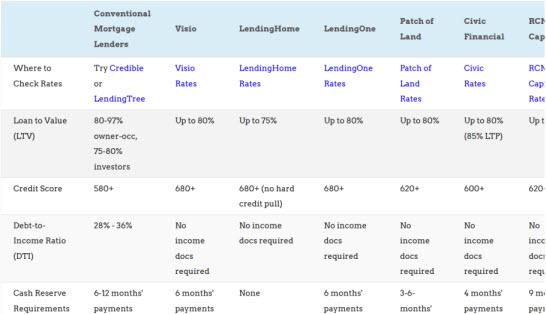 What short-term fix-and-flip loan options are available nowadays?
How about long-term rental property loans?
We compare several buy-and-rehab lenders and several long-term landlord loans on LTV, interest rates, closing costs, income requirements and more.
Real Estate Appreciation, State Tax Burden, and Migration
Demand drives home prices.
I looked at the relationship between state tax burden and real estate appreciation to see if there was a correlation. Sure enough, the ten states with the lowest tax burden saw an average appreciation of 40.86% over the three years from Q1 2020 through Q1 2023, compared to the highest-taxed states’ average appreciation of 33.59%.
As home price growth continues slowing (or even declining), it will be interesting to see whether taxes drive more of a gap or not.
For a breakdown of year-over-year housing appreciation across the US, check out our real estate heat map. Often it’s the cheapest real estate in the U.S. that appreciates the fastest!
Real Estate Investing Opportunities?
Inbound migration means population growth, which is the greatest single predictor of real estate appreciation. Investors always want to keep an eye on what markets are growing quickly, because those markets usually experience demand growth that outpaces new housing supply.
It’s why we looked at population growth in our analysis of best cities for real estate investing in 2024, and didn’t just look at the cities with the highest cap rates.
State tax burdens also matter for investors, and not only because of their strong correlation with migration patterns. Lower property taxes are particularly relevant to real estate investors, because of their direct impact on cash flow.
Don’t think property tax bills make much of a difference to your cash flow? Consider that the average annual property tax bill in Alabama last year was $776. Compare that to the average property tax bill in New Jersey: $8,477. The monthly cost of that tax bill is almost as high as the annual tax bill in Alabama!
Final Thoughts
Low-tax, high-migration states, cities, and towns are a gold mine for real estate investors. You don’t need to invest in your own backyard; in today’s world, nothing stops you from investing in real estate long-distance, especially through turnkey property platforms like Roofstock.
And let’s be honest, tax burdens don’t tell the whole story. After all, California has relatively high tax rates but it’s hard to argue with the weather in San Diego.
But there’s a clear correlation between tax burdens and Americans’ moving patterns. If you want to invest where demand is sure to grow, look at states where taxes are low and movers are inbound, rather than fleeing.
What are your thoughts on the above state tax comparison data? Would you consider moving to a lower-tax state?
About the Author

G. Brian Davis is a real estate investor and cofounder of SparkRental who spends 10 months of the year in South America. His mission: to help 5,000 people reach financial independence with passive income from real estate. If you want to be one of them, join Brian and Deni for a free class on How to Earn 15-30% on Fractional Real Estate Investments.
Reach out through the void!


Wow! Fascinating data. Makes total sense. Makes me wonder why I’m paying so dang much in state and local taxes!
I hear ya Chelsea. For many years I blew way too much of my income on high state and local taxes as well. A difference of 5% of your income is thousands upon thousands of dollars a year! Money that can be invested elsewhere.
Yes, I live in an area where the taxes are ridiculous and climbing higher. Services are becoming less BUT they are building an unnecessary monstrous new school when there is absolutely nothing wrong with the existing. Makes me furious every time I pass by it!
I don’t mean to take it to a super political place, but this is about as close to a real-world validation as possible, for how higher taxes are harmful to an economy.
States with better fiscal responsibility, leaner budgets and lower taxes are now reaping the benefits of their discipline from 5, 10, 20 years ago. It’s no fun to be on a lean budget while your neighbor is spending spending spending, but it pays off in the long term.
Fiscal responsibility is definitely a long-term payoff, which is probably why most elected politicians only pay lip service to it, since they’re operating in the short-term. But it definitely goes to show you how lean, accountable state budgets can pay dividends.
Seriously, amen to that!
Very, very cool article. Thanks for putting this together, absolutely fascinating
Thanks Patrick! We’ll keep writing if you keep reading. Deal?
Thank you Patrick. Brian definitely sheds light on some great topics. That is our aim! Feel free to let us know if there is an particular subject matter you would like to learn more about.
Great post guys, thanks for putting all this together. Everyone in our area is talking about a large influx of residents into the Nashville area, but I was interested to not necessarily see this reflected too much in the actual data … it’s more of a balanced in/out flow it looks like … at least on a state-wide basis. You’ve piqued my curiosity, and it could be interesting to dive a bit deeper and see in/out flows for major metropolitan areas, not just states. Any ideas on sources for that type of data? TN has reasonable property taxes and no individual state income tax, and that along with well-paying jobs in the healthcare industry here in Nashville would seem a boon to real estate values locally, but I would be curious to know if migration patterns actually confirm that.
Hi Josiah, I don’t have Nashville-specific data, but the UVL report did also acknowledge a trend of movement toward metropolitan areas, and away from rural areas. I would suspect that disproportionate amount of the migration into Tennessee is toward Nashville, along with much of the intra-state moves.
PLEASE SHARE THIS INFORMATION TO FACEBOOK USERS
Glad to hear you enjoyed the article Edwin!
You guys always come up with the most fascinating data! Seriously love your blog.
My husband and I have been exploring moving from New Jersey to Florida for the last year, as NJ is one of the highest-taxed states and Florida has some of the lowest state income taxes. This is definitely a good kick in the rear to get in gear!
Thanks Kelly! Keep us posted on the move!
This article was really useful for me and my family, we are still deciding on which state to move into this year. Anyway, big thanks from Florida!
Thanks Heidi, best of luck in your upcoming move!
What a very informative article. Thanks for sharing these trends about taxes and migration patterns!
Glad you found it interesting Nancy!
You got a permanent reader. Keep posting great content!
Much appreciated Victoria!
I’m planning to move out by the end of the year and checking the best place to invest in. This is a good reference!
Keep us posted on where you end up moving Tina!
This is great! Investing long distance is my uprising portfolio and the chart is like a treasure map! When will the 2022 data be posted? Please let me know, thanks!
Haha, love it Miranda. We’ll have to wait until early 2023 to see how Americans moved over the course of 2022, but I find this sort of data fascinating.
Fascinating stuff.
I think so too Nichole!
Fascinating the niches in real estate out there. Never would have occurred to me to invest in some of these. Cool stuff
Absolutely Jamaica!