First Things First – How Is WalletHub Evaluating Cities?
WalletHub took 15 metrics, which they separated into “Sociodemographics” and “Jobs & Economy”. You’ll see that population growth accounts for a whopping 25% of the total score, while most metrics were only weighted at 3.7%: Sociodemographics – Total Points: 50- Population Growth: Double Weight (~25.00 points)
- Working-Age (16-64) Population Growth: Full Weight (~12.50 points)
- College-Educated Population Growth: Full Weight (~12.50 points)
- Job Growth: Double Weight (~3.70 points)
- Increase in Ratio of Full-Time to Part-Time Jobs: Half Weight (~1.85 points)
- Median Household Income Growth: Full Weight (~3.70 points)
- Unemployment Rate Decrease: Full Weight (~3.70 points)
- Poverty Rate Decrease: Full Weight (~3.70 points)
- Growth in Regional GDP per Capita: Double Weight (~7.41 points)
- Increase in Number of Businesses: Full Weight (~3.70 points)
- Increase in Number of Startups: Full Weight (~3.70 points)
- Increase in Venture Capital Investment Amount: Full Weight (~3.70 points)
- Median House Price Growth: Full Weight (~3.70 points)
- Building-Permit Activity Growth: Full Weight (~3.70 points)
- Foreclosure Rate Decrease: Full Weight (~3.70 points)
Here are their top 20 metro areas by economic growth:
| Overall Rank* | City | Total Score | 'Sociodemographics' Rank | 'Jobs & Economy' Rank |
|---|---|---|---|---|
| 1 | Frisco, TX | 76.01 | 1 | 27 |
| 2 | Kent, WA | 68.32 | 2 | 138 |
| 3 | Lehigh Acres, FL | 67 | 3 | 65 |
| 4 | Meridian, ID | 62.71 | 4 | 69 |
| 5 | Midland, TX | 62.64 | 6 | 14 |
| 6 | McKinney, TX | 62.42 | 5 | 31 |
| 7 | Fort Myers, FL | 62.33 | 8 | 10 |
| 8 | Bend, OR | 60.96 | 27 | 1 |
| 9 | Austin, TX | 59.88 | 15 | 7 |
| 10 | Pleasanton, CA | 59.69 | 9 | 56 |
| 11 | Saint George, UT | 58.7 | 26 | 3 |
| 12 | Murfreesboro, TN | 58.41 | 12 | 47 |
| 13 | Irvine, CA | 58.06 | 7 | 117 |
| 14 | Round Rock, TX | 57.87 | 17 | 37 |
| 15 | Cape Coral, FL | 57.35 | 24 | 21 |
| 16 | Odessa, TX | 57.18 | 20 | 36 |
| 17 | Springdale, AR | 56.96 | 16 | 61 |
| 18 | Milpitas, CA | 56.28 | 46 | 2 |
| 19 | Boynton Beach, FL | 55.67 | 41 | 12 |
| 20 | Charlotte, NC | 55.45 | 34 | 39 |
Price/Rent Ratio
Economic growth is all well and good, but what about cash flow? How much rental income will my purchasing dollars buy me?
That’s where price/rent ratio comes into play. The ratio is a simple way to compare median real estate prices with median rents:
Purchase Price
_________________________________
Annual Rents (monthly rent X 12)
A lower ratio is better for investors: it means that prices are relatively low compared to rents.
“But wait a minute, what if homes being sold are more upscale than homes being rented?”
Good point. Which is why we pulled our data from Zillow, who takes only properties that have been listed for rent, and compares the rent with their Zestimate (Zillow’s home value estimate).
“What about other numbers that contribute to cash flow, like vacancy rate?”
Fortunately, an influx of population and jobs does wonders for slashing vacancy rates. Yes, cash flow is more than just rent minus mortgage, but if you look at the metrics WalletHub used, they paint a rounded picture of ballooning demand and shrinking poverty.
We cross-referenced the list of economically-booming cities with their price/rent ratio, to see which cities are a “bargain” for rental investors.
So, How Does the List Shake Out?
We split the list into three separate lists: large cities (300,000+ population), mid-size cities (100,000-300,000), and small cities (under 100,000 residents). First, it helps us identify trends. But it’s also useful for investors who prefer to invest in smaller or larger cities. Here are the lists:| WH Rank | Large Cities | WH Score | P/R Ratio | Mid-Sized Cities | WH Score | P/R Ratio | Small Cities | WH Score | P/R Ratio | ||
|---|---|---|---|---|---|---|---|---|---|---|---|
| 1 | Austin, TX | 59.88 | 14.06 | Frisco, TX | 76.01 | 13.49 | Meridian, ID | 62.71 | 13.34 | ||
| 2 | Charlotte, NC | 55.45 | 11.62 | Kent, WA | 68.32 | 14.98 | Fort Myers, FL | 62.33 | 10.65 | ||
| 3 | Denver, CO | 54.36 | 15.82 | Lehigh Acres, FL | 67 | 10.19 | Bend, OR | 60.96 | 17.33 | ||
| 4 | Seattle, WA | 52.65 | 21.25 | Midland, TX | 62.64 | 8.18 | Pleasanton, CA | 59.69 | 23.87 | ||
| 5 | Nashville, TN | 51.38 | 12.26 | McKinney, TX | 62.42 | 13.06 | Saint George, UT | 58.7 | 13.61 | ||
| 6 | San Jose, CA | 50.64 | 22.22 | Murfreesboro, TN | 58.41 | 12.51 | Springdale, AR | 56.96 | 10.11 | ||
| 7 | Miami, FL | 50.01 | 12.16 | Irvine, CA | 58.06 | 20.07 | Milpitas, CA | 56.28 | 23.04 | ||
| 8 | Oakland, CA | 48.99 | 18.68 | Round Rock, TX | 57.87 | 12.18 | Boynton Beach, FL | 55.67 | 10.69 | ||
| 9 | San Francisco, CA | 48.98 | 23.51 | Cape Coral, FL | 57.35 | 11.57 | Redwood City, CA | 54.33 | 27.59 | ||
| 10 | Raleigh, NC | 48.87 | 12.69 | Odessa, TX | 57.18 | 8.01 | Concord, NC | 54.11 | 11.65 |
Where Shouldn’t I Invest?
Cities with shrinking or stagnating economies make for bad long-term investments. While some landlords make a niche out of buying dirt cheap in decaying cities and then milking rents as long as possible, it’s exactly that: a niche. In other words, don’t try it unless you know exactly what you’re doing. Here are the bottom 20 cities in America for economic growth:| Overall Rank* | City | Total Score | 'Sociodemographics' Rank | 'Jobs & Economy' Rank |
|---|---|---|---|---|
| 496 | Springfield, IL | 25.45 | 432 | 508 |
| 497 | Cleveland, OH | 25.4 | 469 | 497 |
| 498 | Kenner, LA | 25.26 | 489 | 482 |
| 499 | Lawton, OK | 25.25 | 464 | 499 |
| 500 | Peoria, IL | 25.04 | 409 | 511 |
| 501 | Las Cruces, NM | 24.79 | 387 | 512 |
| 502 | Syracuse, NY | 24.79 | 483 | 496 |
| 503 | New Britain, CT | 24.74 | 503 | 455 |
| 504 | Erie, PA | 24.46 | 492 | 489 |
| 505 | Topeka, KS | 24.09 | 514 | 417 |
| 506 | Waterbury, CT | 23.4 | 501 | 488 |
| 507 | Racine, WI | 23.24 | 505 | 481 |
| 508 | Fort Smith, AR | 23.21 | 495 | 500 |
| 509 | Davenport, IA | 22.98 | 491 | 506 |
| 510 | Baton Rouge, LA | 22.81 | 513 | 476 |
| 511 | Montgomery, AL | 22.72 | 508 | 480 |
| 512 | Decatur, IL | 22.54 | 494 | 505 |
| 513 | Fayetteville, NC | 20.97 | 457 | 514 |
| 514 | Jacksonville, NC | 19.06 | 496 | 513 |
| 515 | Shreveport, LA | 17.38 | 506 | 515 |
A Few Fun Comparisons
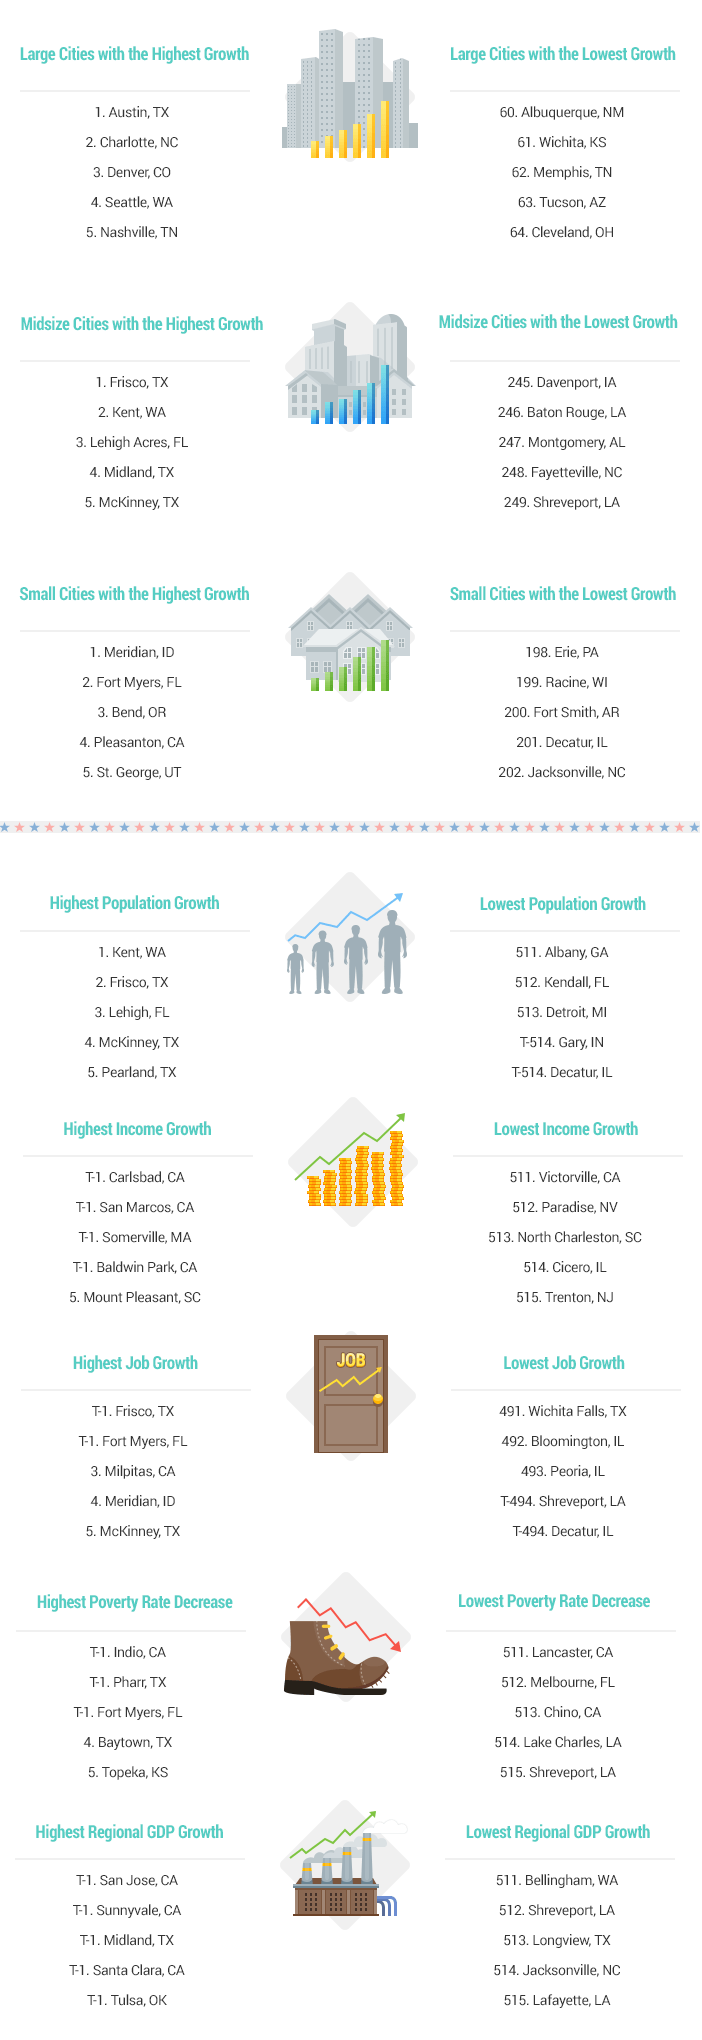
Want a few side-by-side looks at the best and worst? Or a closer look at individual metrics? Here’s a quick (and graphical because that’s more fun!) breakdown:
Beyond Your Own Backyard
In our Passive Income course, we generally encourage new rental investors to stick within an hour of home. But if you’re ready to spread your wings and do some long-distance investing, the cities listed with high economic growth and low price/rent ratios are a good place to start. When you choose a long-distance market you’re not familiar with, you have two choices. Either you become intimately familiar with it, or you partner with somebody who already knows it inside and out. Option 3, investing without knowing a market, is better known as gambling. Should you sell your stock portfolio and go put every penny into Lehigh Acres, FL or Midland, TX? Of course not, but this list can at least set your wheels spinning on options beyond your own backyard, and where you might be able to take your real estate investing to the next level. Happy cash flow!What to Do Now:
- Comment below: Have you ever done any long-distance investing before? Considering it now? If so, where are you thinking about?
- If you’re new to the rental investing game, download our free Recipe for Rental Income: 5 Steps for Your First $500/Month in Passive Income.
- Enjoy this article? Did it raise some questions and ideas that got you thinking? If so, your friends, colleagues, and family members will probably also get something out of it. Share it with them on Facebook or Twitter. You can also follow us on Facebook and or Twitter for awesome daily doses of, well, real estate awesomeness ?


What is up with Texas? There seems to be a whole lot of investing opportunities there.
Indeed Linda! Although one thing to watch out for is high-ish property taxes there. But some strong growth and reasonable price/rent ratios nonetheless 🙂
What is up with Texas? There is a whole lot of investing opportunities there!
Very cool breakdown! I’ve only ever invested in my own city, but prices are getting high here, so I’ve been thinking about where else I could invest. This list was a great starting point.
Glad it was helpful Cara!
Love this and how it breaks everything out! Food for thought, thanks!
Thanks Thomas!
Love the data-oriented approach. Great food for thought, on new markets.
I’ve found that at a certain point in real estate investors’ careers, they start thinking beyond their own backyards. Hoping this gives everyone a starting place at least, for researching new markets!
I live in Washington DC and my first investment was a mixed use property in Hudson, OH a small town between Akron and Cleveland. I was very familiar with residential investment returns in DC and NYC and these returns where much higher. An example of low prices and high rents
Glad to hear it worked out well for you Margarita! And I totally agree – in the most popular, most sexy, most glamorous cities, returns tend to be much lower than their less-glorified counterparts.