The last two years have seen a wild ride for real estate markets across the country.
Year over year, median home prices ticked up 3.13% nationwide as of the start of 2024, closing at $342,941. That marks a sharp fall from the lofty 19.58% appreciation in 2021 or even the 10.77% growth in 2022. Over 200 cities saw cooling home prices across the U.S. last quarter.
But nationwide home prices are still up for the last year, despite what sensationalist headlines have been shouting.
Meanwhile, median rents grew at 3.41% annually to $1,958 at the start of 2024. But that too pales beside the 13.89% growth in 2021 and 7.45% growth in 2022, as rents have lost steam for the last year as well.
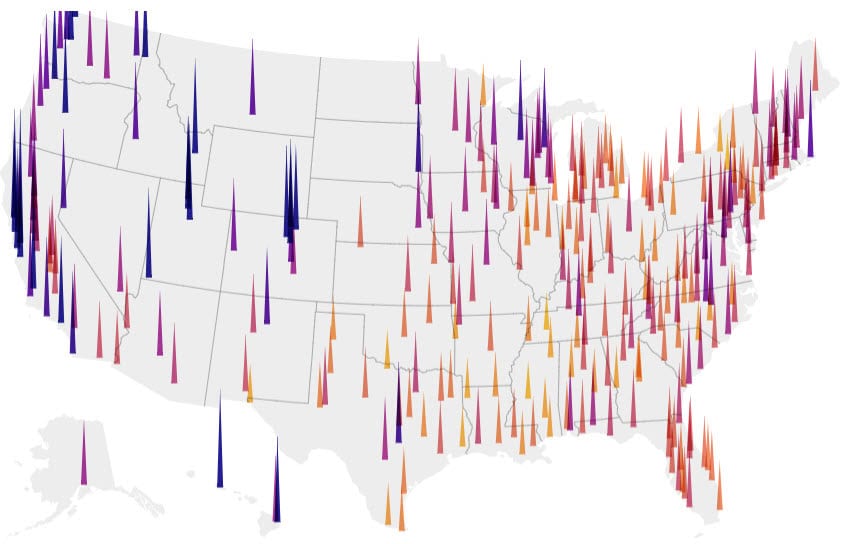
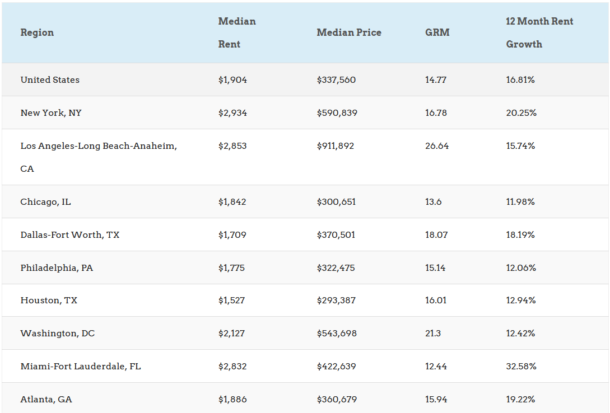
All that said, some cities offer far better yields than others. Below you’ll find the top 300 cities in the U.S. by population, mapped with their GRM, median rent, and median home price.
What Is GRM (Gross Rent Multiplier)
Gross rent multiplier is one of those real estate terms that sounds more complicated than it is. It’s actually one of the easiest concepts in real estate investing.
Quite simply, gross rent multiplier is the ratio between a home’s price and its gross annual rental income. Just divide the price by the gross annual rents, and you get the ratio:
GRM = Price of Property/Gross Annual Rental Income
For example, if a property costs $150,000, and it generates gross rental income of $15,000 per year, the GRM is 10 ($150,000 / $15,000 = 10). Lower is better for GRM, indicating higher rents and lower prices.
Here’s a quick GRM calculator in case you don’t love math:
Another way to think of GRM is the number of years it would take for a property to pay for itself in gross rents. If a property generates $15,000 per year, and costs $150,000 to buy, it would take 10 years to pay for itself. Not including expenses, that is.
Which makes an important point: GRM doesn’t include expenses the way cap rates do. That makes it a simpler — but less accurate — calculation.
Best Cities for Real Estate Investing by GRM
The following map shows the top 300 cities in the country by population:
Note that there are many smaller cities and towns in the US with better cap rates. These are simply the 300 most populous cities in the U.S. I used these because Zillow makes this data easily available.
We’re finally starting to see GRMs starting to ease down slightly, and cap rates starting to tick up. While home prices shot upward in the pandemic and rents held steady during the eviction moratorium, rents have since leapt to catch up to soaring home prices. Rising interest rates may cool prices in the hottest real estate markets, even as rents keep soaring.
All of which is good news for real estate investors and landlords. Nationwide, the average gross rent multiplier in the U.S. is 14.19 as of the end of the third quarter of 2023.
If you want to invest in real estate long-distance, consider buying turnkey properties through a platform like Roofstock or off-market seller like Norada. The majority of the investors there buy the properties sight-unseen, and feel comfortable doing so given the massive amount of third-party data provided with each listing.
We update this map every quarter, to keep you informed about the best cities for real estate investing.
More Maps for Gits & Shiggles
If you couldn’t tell, I love interactive maps.
Here are some useful and relevant maps for real estate investors looking for the perfect place to invest.
Top 100 Fastest Appreciating Cities in the US
Where are home prices rising the fastest?
Most of these are either smaller cities or towns, or satellite towns near larger metropolitan areas.
Remember, past performance does not indicate future results, yada yada yada. But it does indicate faster demand growth in these cities than anywhere else in the country.
Property Taxes by County
Property taxes aren’t your only ongoing expense as a real estate investor, but they can impact your bottom line. Especially in areas with other high taxes (like income taxes and sales taxes), and especially in states where more Americans are moving out than moving in. See our data analysis comparing total state tax burden with US migration patterns.
Final Word
Gross rent multiplier doesn’t tell you the whole story about the best places to invest in real estate. No one data point can.
But GRM does help you find cities with relatively higher rents and lower home prices. It can help you identify promising cities to start your hunt for ideal neighborhoods and stellar deals on rental properties.
Check back frequently, as we continue updating this interactive map and data set!♦
Where are you currently investing in rental properties? How did you choose those cities?
More Real Estate Investing Reads:
About the Author

G. Brian Davis is a real estate investor and cofounder of SparkRental who spends 10 months of the year in South America. His mission: to help 5,000 people reach financial independence with passive income from real estate. If you want to be one of them, join Brian and Deni for a free class on How to Earn 15-30% on Fractional Real Estate Investments.












Just a heads-up, it looks like this post is missing its title.
Thanks Matthew! Somehow it got deleted in the various draft revisions.
This is very informative!
Thanks for the comment Heidi!
Very informative and useful graphics for investors.
One correction: In the map of “Top 100 Hottest Real Estate Markets by Appreciation,” the circle for Blythe, GA, is incorrectly placed in California, about where Blythe, CA, is located. It should be in Georgia because the county listed for Blythe is Augusta-Richmond County, which is in Georgia.
Good catch Teresa! Unfortunate side effect of the software I used to create the map. I’ll try and fix it.
GRM Calculator really helpful! Because I don’t like doing the math every time.
Glad you found it useful Patrick!
Great information Brian, thank you for posting! I’m an investor & property manager; any suggestions to get ride of a deadbeat tenant (where my Landlord has already gotten a judgment for non-payment back in March); the courts here in the Phoenix area are blocking evictions – Thank you Steve Weber
Thanks Steve! Yeah it’s been tough for a lot of landlords to enforce their lease agreements over the last year. We did a podcast episode a few weeks back on alternative options to get rid of bad tenants (other than eviction), check it out: https://sparkrental.com/ep-39-4-alternative-ways-to-get-rid-of-a-bad-tenant-other-than-eviction/.
This is too good! Thank you for sharing with us.
Glad you got something out of it Kane!
As an owner of my property management company in Cincinnati, I love to invest in Cincinnati, OH. Thanks for sharing this kind of useful information I love to read this post again.
Glad to hear Cincinnati is working out well for you for rental properties Owen!
I’m just curious if GRM would change in the next year or so because of what is happening in the west. Is it going to affect real estate?
Over the last two years, home prices have risen far faster than rents, leading to worsening cap rates and GRMs. However this year I expect rents to rise faster than home prices, improving conditions for rental investors.
This helps a lot in search of out-of-state investment! Thanks for sharing!
Glad it was helpful Don!
Interesting use of GRM. I’m looking forward to exploring these cities further.
Glad you found it helpful Barbie!
Thanks Brian. Useful data for informed decisions about where to invest in rental properties.
Glad to hear it was helpful Christine!
Thank you for sharing this valuable data. The GRM for my properties is above 12, and according to Google, a “Good” GRM is considered to be in the range of 4 to 7. Initially, I was not pleased with that number. However, after reviewing your data, I feel better now. Thank you!
Glad to hear it was helpful for you Ally!