
We talk all the time about how the wealthy invest in real estate. Today, you get to see just how much they like it.
And stack your own finances up against the average American.
But no matter how your finances compare to the median American income or net worth, don’t feel discouraged. I quadrupled my net worth in just five years by living on a budget while maintaining a high savings rate.
Every three years, the Federal Reserve releases its Survey of Consumer Finances. They released data for 2020-2022 in late 2023, including median income and net worth by age, and real estate ownership details by age and net worth.
Median Income by Age
How does your income compare to the average American’s?
Across all Americans, the median household income was $74,580. For adults age 18-34, the median income clocked in at $60,530. The median household income for adults age 35-44 was $86,470, and $91,880 for households headed by someone aged 45-54. That latter represented the highest earning age group.
Median incomes dropped back down in households led by adults aged 55-64, at $82,150. They drop further to $60,530 for households in the 65-74 range, and to $49,070 for households aged 75 and above.
Here are those numbers side-by-side:
-
- Under 35: $60,530
- 35-44: $86,470
- 45-54: $91,880
- 55-64: $82,150
- 65-74: $60,530
- 75 or older: $49,070
By sheer coincidence, the median household income is exactly the same for households aged 18-34 and those aged 65-74.
Those numbers represent before-tax household income, before Uncle Sam takes his pound of flesh.
Median Income by State
Not all states are created equal. Maryland’s median income is more than double Mississippi’s, for example. You can thank high taxes for all the federal government money lining people’s pockets in and around Washington D.C.
Here’s how median household incomes look mapped out:
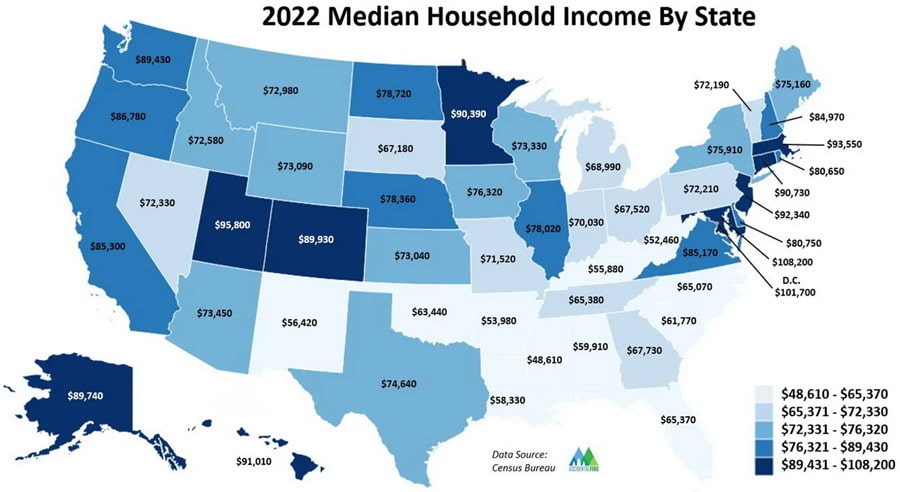
Map courtesy of Dave at Accidental FIRE
If there are any surprises, they’re Utah, Minnesota, and Alaska. I didn’t know so many high rollers lived there.
Median Net Worth by Age
More income makes it easier to build wealth, but certainly doesn’t guarantee it. You could earn $1,000,000 a year, but if you spend $1,000,001, you got poorer that year.
Here’s the median net worth for each age group:
-
- Under 35: $39,0400
- 35-44: $135,300
- 45-54: $246,700
- 55-64: $364,270
- 65-74: $410,000
- 75 or older: $334,700
The faster you build your net worth, the faster you can build up streams of passive income. And the sooner you can become work optional, having reached financial independence.
(article continues below)
Real estate investments? Awesome.
Being a landlord? Less fun.
Learn how to earn 15%+ on passive real estate investments in our free video course.

Median Income & Net Worth by Percentile
Curious about how median income and net worth look for different percentiles of Americans?
Me too. Here’s how they break down:
| Percentile | 0-25 | 25-49.9 | 50-74.9 | 75-89.9 | 90-100 |
| Median Income | $34,589 | $59,450 | $83,230 | $140,519 | $301,574 |
| Median Net Worth | $3,471 | $93,400 | $356,900 | $1,036,300 | $3,795,000 |
I confess, I selfishly found it a little disheartening that you could be a millionaire and still not be in the top 25th percentile of households by net worth. Guess I still have a long way to go if I want to become a one-percenter!
Real Estate Ownership by Age
Median income and net worth are all well and good, but this is a real estate blog, gosh dangit! What does any of this have to do with real estate investing?
Well, admittedly I just like geeking out on these numbers. But I also dug into real estate ownership for different groups.
Here’s how real estate ownership breaks down for different age groups:
| % Ownership by Age | Less than 35 | 35-44 | 45-54 | 55-64 | 65-74 | 75 or older |
| Primary Residence | 38.50% | 61.10% | 70.70% | 77.80% | 76.10% | 81.00% |
| Other Residential Real Estate | 4.70% | 9.40% | 12.20% | 18.60% | 18.80% | 16.30% |
| Non-Residential Real Estate | 0.80% | 3.90% | 6.30% | 7.40% | 11.20% | 6.50% |
“Other residential real estate” includes second homes and investment properties, such as long-term rental properties and Airbnb properties.
“Non-residential real estate” includes investments like real estate syndications and real estate crowdfunding holdings.
So how much equity does each age group have, in each type of property investment?
| Median Equity Ownership by Age | Less than 35 | 35-44 | 45-54 | 55-64 | 65-74 | 75 or older |
| Primary Residence | $250,000 | $350,000 | $380,000 | $350,000 | $320,000 | $286,000 |
| Other Residential Real Estate | $120,000 | $280,000 | $270,000 | $250,000 | $195,000 | $140,000 |
| Non-Residential Real Estate | $70,000 | $55,000 | $160,000 | $100,000 | $150,000 | $218,000 |
(article continues below)
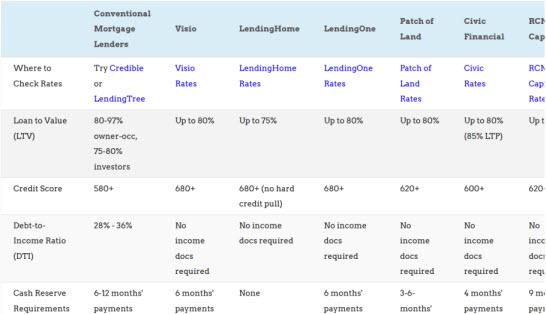 What short-term fix-and-flip loan options are available nowadays?
How about long-term rental property loans?
We compare several buy-and-rehab lenders and several long-term landlord loans on LTV, interest rates, closing costs, income requirements and more.
Median Real Estate Ownership by Percentile
First, here’s the percentage of people who own real estate, at different net worth percentiles:
| % Ownership by Percentile | Less than 25 | 25-49.9 | 50-74.9 | 75-89.9 | 90-100 |
| Primary Residence | 8.10% | 70.00% | 91.50% | 94.00% | 95.40% |
| Other Residential Real Estate | 1.10% | 5.70% | 11.80% | 26.30% | 43.80% |
| Non-Residential Real Estate | 0.60% | 3.60% | 5.00% | 9.10% | 21.80% |
As you can see, there’s a huge jump in homeownership rates between the bottom quartile and the 25-49.9% quartile.
It comes as no surprise that wealthier people own more rental properties and second homes. But what jumped out to me was just how few people in the 50-89.9% range own equity in non-residential real estate. Only the wealthiest 10% own non-residential real estate investments in any significant numbers.
Among households that did own these real estate assets, here’s their median equity in each:
| Median Equity Ownership by Percentile | Less than 25 | 25-49.9 | 50-74.9 | 75-89.9 | 90-100 |
| Primary Residence | $88,000 | $169,000 | $300,000 | $500,000 | $900,000 |
| Other Residential Real Estate | $10,000 | $49,000 | $120,000 | $240,000 | $575,000 |
| Non-Residential Real Estate | $13,000 | $20,000 | $50,000 | $185,000 | $430,000 |
The Wealthy Love Real Estate Investments
How do we know the rich love real estate investing?
Because the wealthiest 10% own more investment real estate than the bottom 90% combined.
Most of them aren’t out there taking phone calls from tenants at 2am though. They invest passively in private equity real estate investments, which come with all the cash flow, appreciation, and tax benefits of investment properties, without any of the headaches of landlording.
It’s how I personally invest nowadays, in group real estate investments. I don’t miss the renovations or renters, don’t miss the contractors or property managers or permits or city inspectors. I just collect the cash flow and profits… and go back to living my life.♦
How do you invest in real estate? How does your income and net worth stack up against the average American?
More Real Estate Investing Reads:


About the Author

G. Brian Davis is a real estate investor and cofounder of SparkRental who spends 10 months of the year in South America. His mission: to help 5,000 people reach financial independence with passive income from real estate. If you want to be one of them, join Brian and Deni for a free class on How to Earn 15-30% on Fractional Real Estate Investments.
Connect with us on social!


I’ve developed a strong interest in real estate because I see how it works for the wealthy. They own more investment properties than most people do. Nowadays I go for passive investments that provide financial gains without the troubles of managing properties. Direct investing is a young person’s game.
Agreed Erik!
Great post Brian, wonder what the trends are for the last 10 years in home ownership, I would think it’s gone up, because of the low interest rate environment for so long. But going forward I foresee home ownership to drop a bit in 2023, and maybe 24. I do expect rates to come down in 24, but maybe there is a lag in the data? Good stuff here!
Some interesting data here. If anything, I’m surprised the wealthiest 10% don’t own MORE real estate. Thanks for putting this together.
Glad you got something out of it Yatcha!
Thanks for sharing!
Absolutely Anya!
As someone in the 35-44 age range, this motivates me to assess my financial goals more seriously.
Glad to hear it Peter!